Communication Monopole Steel Tower – Seismic Performance Analysis

Corrosion Prevention for Transmission Line Tower Structures
September 26, 2026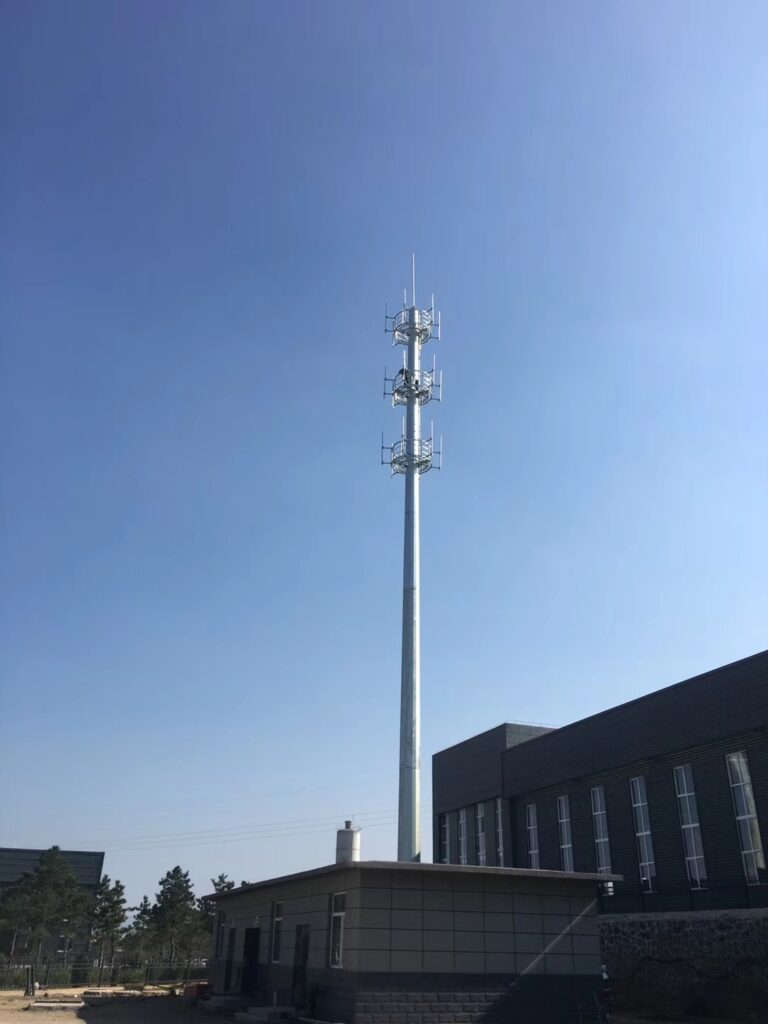
1. Research Scope and Engineering Objective
The purpose of this study is to verify the structural safety of a typical communication monopole steel tower subjected to seismic ground motion. A representative telecommunication monopole was selected as the study object and reduced to an appropriate finite-element idealisation through rational structural simplification. Referring to the Intensity 8 rare earthquake requirements specified in the applicable Chinese design codes, the seismic performance of the structure was calculated and evaluated by three complementary routes: the equivalent static analysis method, the mode-superposition response spectrum method, and the nonlinear time-history method. The results obtained from the three calculation routes were then compared to identify the differences between the analytical approaches, and the overall seismic performance of the communication monopole was assessed through a comprehensive synthesis of the computed responses.
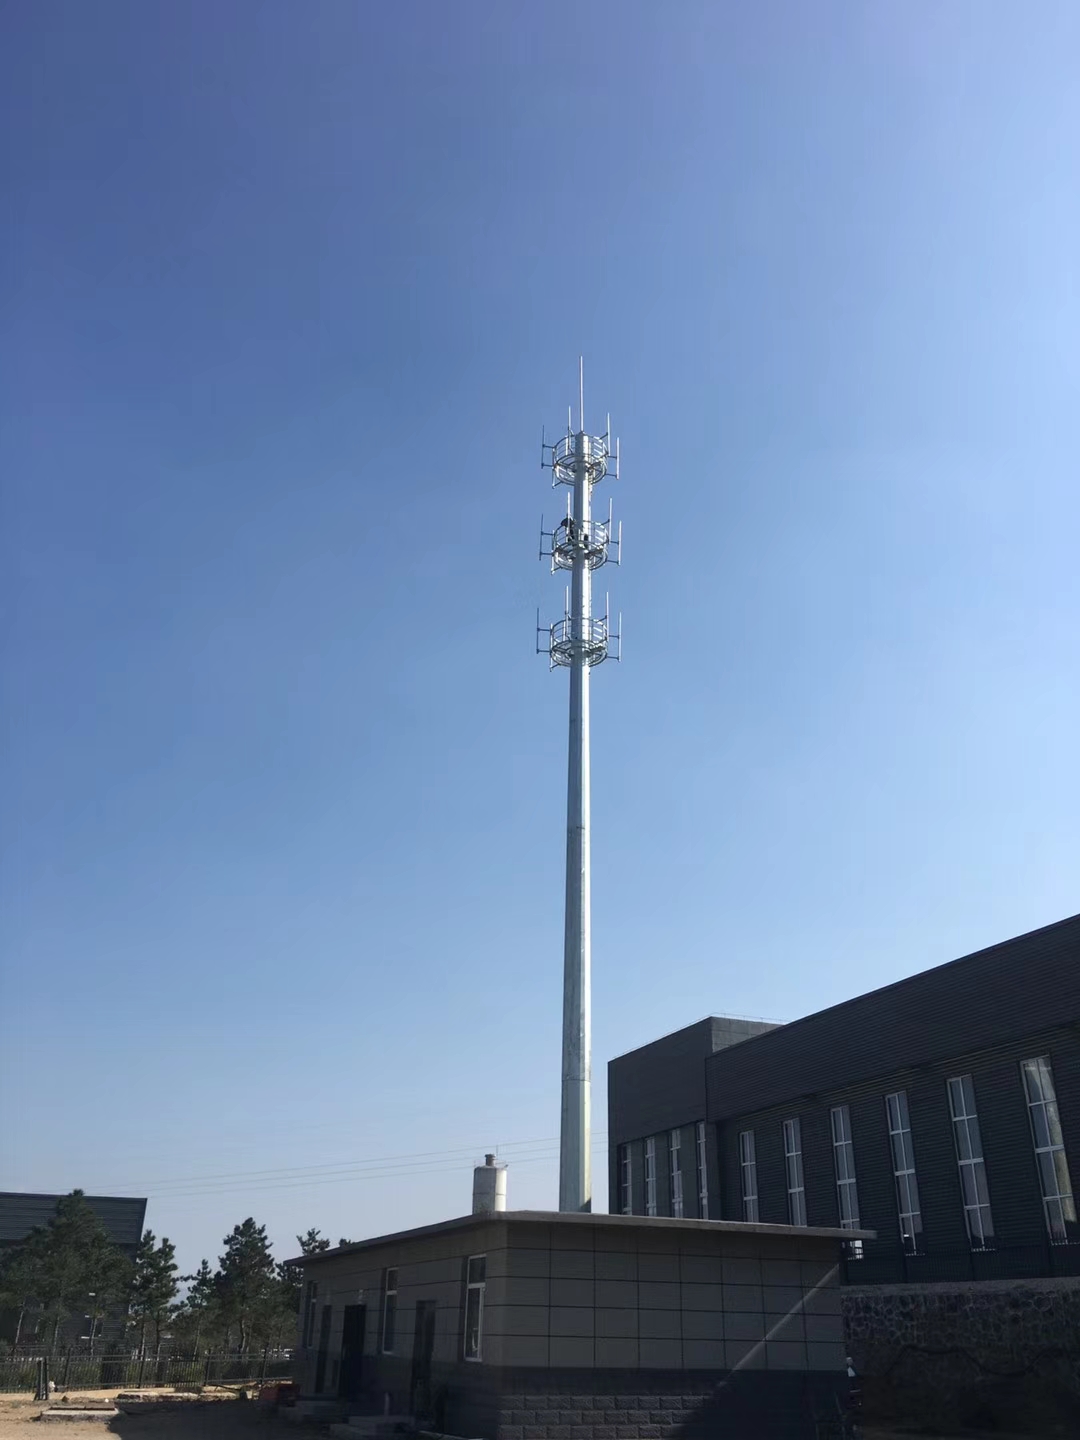
The principal load-carrying element of a communication monopole tower is a single cantilever steel tube that is large at the bottom and small at the top, with a gradually varying cross-section. Because the height of the structure greatly exceeds its diameter, the tower is a classic high-rise (slender) structure. At the same time, the diameter-to-thickness ratio of a monopole communication tower is usually very large, so the structure behaves as a thin-walled shell, and lateral displacement under lateral loads such as earthquake and wind is significant. In addition, because of the self-weight of the tower and the concentration of platform masses at the top, the P-Δ effect of the communication monopole is pronounced and the structural response is strongly nonlinear.
Owing to the limited capacity of domestic earthquake-simulation shaking tables, full-scale prototype shaking-table testing of communication monopoles is not feasible. Instead, Code for Design of High-Rising Structures (GB 50135–2006), Code for Seismic Design of Buildings (GB 50011–2010) and Code for Design of Steel Tower and Mast Structures for Mobile Communication Engineering (YD/T 5131–2005) all permit the seismic performance of a communication monopole to be determined by the finite-element method. This dossier therefore documents the complete numerical verification chain, from geometric idealisation to code-compliance conclusion.
2. Key Performance Indicators at a Glance
Consolidated headline parameters extracted from the modal, static, response-spectrum and time-history calculations.
3. Structural Description of the Monopole Tower
The monopole model documented here has a total tower-shaft height of 40 m and a mass of approximately 10.1 t. The tower is fabricated from Q345 steel; the shaft cross-section is a 12-sided polygon and the segment connections are of the socketed (telescoped) type. The tower body is divided from top to bottom into five tower segments, each 8 m long.
4. Segment-by-Segment Wall Thickness Schedule
The wall thickness of the monopole is graded in five steps so that the bending capacity increases toward the base, where the bending moment under lateral seismic action is greatest. Segments 1 to 3 share an 8 mm wall, segment 4 is thickened to 10 mm and segment 5, the base segment, is thickened to 12 mm. For modelling purposes the individual tubes are treated as uniform variable-cross-section shells of equal thickness within each segment, which is consistent with the code-permitted simplification for this structural type.
| Segment | Position | Length (m) | Wall Thickness (mm) | Structural Role |
|---|---|---|---|---|
| Segment 1 | Top | 8 | 8 | Antenna mounting zone, lowest moment demand |
| Segment 2 | Upper-middle | 8 | 8 | Transition region |
| Segment 3 | Middle | 8 | 8 | Mid-height bending transfer |
| Segment 4 | Lower-middle | 8 | 10 | Increased bending resistance |
| Segment 5 | Base | 8 | 12 | Maximum moment region, feeder-cable opening zone |
5. Q345B Steel Mechanical Properties
In accordance with the Code for Design of Steel Structures, the material mechanical properties adopted for Q345B steel with a plate thickness not exceeding 16 mm are summarised in the table below. The values govern the strength check and the elastic-stage conclusion drawn at the end of this analysis.
| Mechanical Property | Design Value | Unit | Applicability |
|---|---|---|---|
| Tensile strength (f) | 310 | MPa | t ≤ 16 mm |
| Compressive strength (f) | 310 | MPa | t ≤ 16 mm |
| Bending strength (f) | 310 | MPa | t ≤ 16 mm |
| Shear strength (fv) | 180 | MPa | t ≤ 16 mm |
| End bearing strength (planed and tight) | 400 | MPa | t ≤ 16 mm |
Utilisation check: the highest computed stress anywhere in the structure is 142 MPa, which is 45.8% of the 310 MPa design strength of Q345B. The structure therefore remains comfortably within the elastic range under Intensity 8 rare earthquake action.
6. Design Code Basis and Referenced Clauses
The verification chain is anchored to three national standards. Each clause listed below was used to justify a specific modelling decision, load combination or acceptance criterion applied within this analysis.
7. Finite-Element Model Idealisation and Statistics
An isotropic material model was used to represent the monopole steel. In order to better simulate the behaviour of the main shaft structure, the ancillary components of the tower — lightning rod, platforms, tower ladder and safety rope — were simplified as lumped mass elements. The tower segments are connected by sockets, flanges or internal bolts, and the structural dimensions and material thicknesses of the individual tube sections are not identical; each is therefore treated as a uniform variable-cross-section tube of equal thickness within the segment. The complete model was discretised into 52,834 nodes and 50,147 elements with a minimum element size of 60 mm.
| Model Parameter | Quantity | Remark |
|---|---|---|
| Total nodes | 52,834 | Including lumped mass attachment points |
| Total elements | 50,147 | Shell, solid and rigid elements |
| Minimum element size | 60 mm | Refined at openings and welded joints |
| Material idealisation | Isotropic | Q345B throughout |
| Ancillary components | Lumped mass | Lightning rod, platforms, ladder, safety rope |
| Solver frequency band | 1 – 50 Hz | Lanczos eigenvalue extraction |
8. Element Types and Connection Modelling Scheme
The accuracy of a monopole seismic assessment depends heavily on how the welded and socketed joints are represented. Plate and shell elements were used for the shaft segments, the base flange stiffeners, the inner ring stiffeners and the reinforcement plates, while solid elements were used for the base flange plate itself. The welded connections were then idealised according to their mechanical function, as tabulated below.
| Connection / Component | Idealisation | Numerical Treatment |
|---|---|---|
| Segment 5 to base flange weld | Shared-node (tie) | Full displacement continuity |
| Base flange stiffener to segment 5 and flange | Shared-node (tie) | Full displacement continuity |
| Inner ring stiffener to segment 5 | Shared-node (tie) | Full displacement continuity |
| Reinforcement plate to segment 5 | Rigid element | Kinematic coupling |
| Segment-to-segment socket | Surface contact | Friction coefficient μ = 0.3 |
| Shaft shell | Plate / shell elements | 4-node shell, tapered section |
| Base flange plate | Solid elements | 3D solid, 30 mm thickness |
9. Boundary Conditions and Analysis Assumptions
The connection between the monopole and its foundation was assumed to be pinned. At each anchor-bolt location in the base flange, translational degrees of freedom in the X, Y and Z directions were restrained. The tower base was assumed to sit on a rigid foundation; consequently, no analysis of anchor-bolt embedment depth or pull-out capacity was performed, and structural damage arising from foundation settlement or soil liquefaction was excluded from the scope.
| Assumption Item | Value / Condition | Engineering Rationale |
|---|---|---|
| Base support condition | Pinned | Cantilever idealisation |
| Restrained DOF at anchor bolts | X, Y, Z translation | Applied at every bolt position |
| Foundation stiffness | Rigid | Soil–structure interaction excluded |
| Anchor bolt embedment check | Not performed | Outside scope of superstructure assessment |
| Foundation settlement / liquefaction | Excluded | Geotechnical hazard not modelled |
| Damping ratio (spectrum and static) | 3% | Per high-rise steel structure practice |
10. Dynamic Characteristic Analysis — Modal Frequencies
The Lanczos method was used to extract the modal shapes and modal frequencies of the monopole within the 1–50 Hz frequency range. Because the monopole structure is centrosymmetric, symmetric bending modes exist in both the X and Y directions, and the dynamic behaviour can be reduced to that of a cantilever beam fixed at one end and free at the other. The resulting modal frequencies are listed below; the first four bending modes in the X direction define the fundamental dynamic signature of the tower.
11. Modal Participating Mass and Mode Count Sufficiency
The modal participation factor of a mode is defined as the sum of the products of each lumped mass and its corresponding coordinate in that mode, divided by the principal mass (modal mass) of the same mode. The participation factor expresses the weight of a mode within the overall response, and therefore quantifies the contribution of each frequency to the structural response in a specific direction. According to FEMA 365, the modal participating mass must reach 90% of the total structural mass. The accumulated participating masses computed here are listed below: the first six modes already approach 90% of the total mass, so that the combination of six modes is sufficient to represent the complete modal superposition result for this tower.
| X-Direction Mode Order | Modal Participating Mass (t) | Cumulative Mass (t) | Cumulative Percentage of 10.1 t |
|---|---|---|---|
| 1st mode | 4.765 | 4.765 | 47.2% |
| 2nd mode | 2.147 | 6.912 | 68.4% |
| 3rd mode | 0.944 | 7.856 | 77.8% |
| 4th mode | 0.539 | 8.395 | 83.1% |
| 5th mode | 0.332 | 8.727 | 86.4% |
| 6th mode | 0.209 | 8.936 | ≈88.5% (near 90%) |
Conclusion: the first six modes capture approximately 90% of the total structural mass, satisfying the FEMA 365 participation criterion. A six-mode combination is therefore adopted for the response-spectrum calculation.
12. Ultimate Limit-State Expression and Partial Factors
Clause 3.0.7 of GB 50135–2006 defines the ultimate limit-state expression to be used in the design of high-rise structures. The general form adopted in this analysis is:
γG·SGE + γEh·SEhk + γEv·SEvk + ψwE·γw·Swk ≤ R / γRE
In this expression γG is the partial factor for permanent load; γEh and γEv are the partial factors for horizontal and vertical seismic action respectively; γw is the partial factor for wind load, taken as 1.4; SGE is the effect of the representative value of gravity load; SEhk is the effect of the characteristic value of horizontal seismic action; SEvk is the effect of the characteristic value of vertical seismic action; Swk is the effect of the characteristic value of wind load; ψwE is the combination value factor for wind load in the basic seismic combination, which may be taken as 0.2; R is the resistance; and γRE is the seismic adjustment factor for resistance, taken as 1.0.
| Factor | Symbol | Value Adopted | Description |
|---|---|---|---|
| Permanent load factor | γG | 1.2 | Gravity and self-weight |
| Horizontal seismic factor | γEh | 1.3 | Horizontal earthquake action |
| Vertical seismic factor | γEv | 0.5 | Vertical earthquake action |
| Wind load factor | γw | 1.4 | Characteristic wind action |
| Wind combination factor | ψwE | 0.2 | Basic seismic combination |
| Seismic resistance adjustment | γRE | 1.0 | Applied to structural resistance |
| Seismic influence coefficient | αmax | 0.9 | Intensity 8 rare earthquake, Site Class IV, Group 3 |
13. Equivalent Static Analysis Results
In accordance with Clause 5.1.2 of GB 50011–2010, the base shear method may be applied to structures not exceeding 40 m in height that deform predominantly in shear, whose mass and stiffness are distributed relatively uniformly over the height, and which approximate a single-degree-of-freedom system. The damping ratio for the communication tower was taken as 0.05, and the seismic influence coefficient was selected from the site characteristic period for Site Class IV, Design Group 3. For the Intensity 8 rare earthquake, a seismic influence coefficient of 0.9 was adopted. Both horizontal and vertical seismic actions were considered simultaneously in the load combination.
| Segment | Max. Stress (MPa) | Location of Max. Stress | Max. Displacement (mm) |
|---|---|---|---|
| Segment 1 | 14 | Segment 1 side wall | 348 |
| Segment 2 | 31 | Segment 2 side wall | 250 |
| Segment 3 | 48 | Segment 3 side wall | 149 |
| Segment 4 | 53 | Segment 4 side wall | 72 |
| Segment 5 | 102 | Segment 5 / reinforcement rib junction | 22 |
The static analysis shows a monotonic increase in stress from the top segment (14 MPa) to the base segment (102 MPa), consistent with the cantilever moment distribution. Displacement decreases downward from 348 mm at the top of segment 1 to 22 mm at segment 5, which confirms that the base shear method captures the first-mode-dominated global sway response.
14. Mode-Superposition Response Spectrum Analysis Results
In accordance with Clause 4.4.4 of GB 50135–2006 and Clause 5.1.2 of GB 50011–2010, the mode-superposition response spectrum method may be used to calculate seismic action on high-rise structures. Both the response spectrum method and the base shear method belong to the response-spectrum family of dynamic methods: they use the standard design spectrum to account for the dynamic acceleration response of the structure caused by ground acceleration during an earthquake, and express the result as equivalent seismic inertia forces applied to the structure, thereby converting a dynamic problem into a static one. The response spectrum method combines the seismic response of the structure in different modes, whereas the base shear method considers only the fundamental (first) mode and is therefore a simplified calculation approach.
15. Nonlinear Time-History Analysis — Ground Motion Input
When the time-history method is adopted, not fewer than two sets of actual strong-motion records and one set of artificially simulated acceleration time-history curves shall be selected in accordance with the building site category and the design earthquake group. Accordingly, two strong-motion records and one artificial synthetic earthquake wave were selected to match the site category, and the peak acceleration of each record was scaled artificially to 0.49 g, satisfying the peak acceleration requirement for Intensity 8 rare earthquake time-history analysis in the code. The nonlinear time-history analysis was then used to compute the seismic action on the structure, with the earthquake acceleration time-history applied at the fixed bolt points at the base of the structure.
| No. | Site Type | Earthquake Wave Name | Rare-Earthquake PGA (g) | Time of Peak (s) |
|---|---|---|---|---|
| 1 | Medium-stiff site | El Centro | 0.4 | 2.12 |
| 2 | Hard soil site | Kobe | 0.4 | 8.52 |
| 3 | Soft soil site | Artificial synthetic wave | 0.4 | 11.80 |
16. Structural Response under Seismic Wave Excitation
The table below reports the maximum stress, the location at which that maximum stress develops, and the maximum displacement for each tower segment under each of the three input ground motions. The peak stress in all three cases occurs at the same location — the feeder-cable opening at the bottom of segment 5 — which establishes this detail as the governing weak link of the structure.
| Wave | Segment | Max. Stress (MPa) | Location of Max. Stress | Max. Displacement (mm) |
|---|---|---|---|---|
| El Centro | Segment 1 | 8 | Segment 1 side wall | 250 |
| Segment 2 | 15 | Segment 2 side wall | 180 | |
| Segment 3 | 22 | Segment 3 side wall | 104 | |
| Segment 4 | 23 | Segment 4 side wall | 51 | |
| Segment 5 | 112 | Feeder-cable opening at segment 5 bottom | 16 | |
| Kobe | Segment 1 | 5 | Segment 1 side wall | 189 |
| Segment 2 | 11 | Segment 2 side wall | 131 | |
| Segment 3 | 15 | Segment 3 side wall | 131 | |
| Segment 4 | 46 | Segment 4 side wall | 38 | |
| Segment 5 | 109 | Feeder-cable opening at segment 5 bottom | 12 | |
| Artificial synthetic | Segment 1 | 13 | Segment 1 side wall | 278 |
| Segment 2 | 32 | Segment 2 side wall | 196 | |
| Segment 3 | 58 | Segment 3 side wall | 157 | |
| Segment 4 | 79 | Segment 4 side wall | 98 | |
| Segment 5 | 124 | Feeder-cable opening at segment 5 bottom | 24 |
17. Cross-Method Comparison of Computed Responses
The three analytical routes produced systematically different results. The comparison below sets the governing values side by side so that the relative conservatism of each method is transparent. The response spectrum method consistently returns the highest stress and displacement, followed by the static base shear method, while nonlinear time-history analysis returns the lowest values because it captures the energy dissipation associated with geometric nonlinearity.
| Response Quantity | Static (Base Shear) | Response Spectrum | Nonlinear Time History (Max) | Governing Method |
|---|---|---|---|---|
| Peak stress (MPa) | 102 | 142 | 124 | Response spectrum |
| Peak displacement (mm) | 348 | 602 | 278 | Response spectrum |
| Segment 1 max. stress (MPa) | 14 | 44 | 13 | Response spectrum |
| Segment 5 max. stress (MPa) | 102 | 142 | 124 | Response spectrum |
| Stress utilisation vs. 310 MPa | 32.9% | 45.8% | 40.0% | All below 100% |
| Elastic / inelastic behaviour | Linear | Linear | Material + geometric nonlinear | Method dependent |
| Mode count considered | 1 (fundamental) | 6 (≈90% mass) | All (direct integration) | FEMA 365 criterion |
| P-Δ effect captured | No | No | Yes | Time history only |
18. P-Δ Second-Order Effect Assessment
Because the self-weight of the tower and the concentrated platform masses at the top act through a laterally displaced structure, a second-order P-Δ moment is generated in addition to the first-order seismic moment. The nonlinear time-history solution accounts for this effect explicitly, whereas the linear response-spectrum route cannot. The comparison below documents the magnitude of the effect for the tower studied.
Finding: according to the nonlinear time-history results from all three ground motions, the P-Δ effect of the selected monopole structure under Intensity 8 rare earthquake action is not significant. The structure responds essentially as a first-order cantilever, and stability-related amplification does not control the design.
19. Weak-Link Identification and Local Detail Assessment
The stress contour results show that the maximum stress in the structure develops at the feeder-cable opening at the bottom of tower segment 5. This opening interrupts the continuous load path of the shell, producing a local stress concentration that is not present elsewhere in the shaft. This location is therefore identified as the weakest link of the structure and should be the focus of any detailing improvement, inspection programme or local reinforcement strategy.
| Rank | Critical Location | Peak Stress (MPa) | Risk Characterisation |
|---|---|---|---|
| 1 | Feeder-cable opening, segment 5 bottom | 124 (time history) / 142 (spectrum) | Shell discontinuity, local concentration |
| 2 | Segment 5 / reinforcement rib junction | 102 – 142 | Stiffness transition, weld toe |
| 3 | Segment 4 side wall | 46 – 103 | Global bending, moderate |
| 4 | Segment 3 side wall | 15 – 83 | Global bending, low |
| 5 | Segment 2 side wall | 11 – 62 | Global bending, very low |
| 6 | Segment 1 side wall | 5 – 44 | Global bending, negligible |
20. Code-Compliance Verification Matrix
The maximum computed stress of the selected monopole structure is 142 MPa, far below the design strength of the material specified in the steel structure design code. The maximum computed displacement is 602 mm. Both quantities are compared against the relevant acceptance criteria in the matrix below.
| Verification Item | Computed | Limit / Criterion | Status |
|---|---|---|---|
| Peak stress vs. design strength | 142 MPa | 310 MPa (Q345B, t ≤ 16 mm) | PASS |
| Peak displacement vs. H/75 | 602 mm | 533 mm (H/75) — spectrum; time-history 278 mm | CHECK PER CODE |
| Fundamental period vs. site period | 1.59 s | Above maximum site characteristic period | PASS |
| Modal participating mass | ≈88.5% in 6 modes | 90% (FEMA 365) | PASS (near 90%) |
| Deformation stage | Elastic | No yielding under rare earthquake | PASS |
| Ground motion record count | 2 actual + 1 artificial | ≥ 2 actual + 1 artificial | PASS |
21. Response Envelope Summary Across All Methods
The envelope of results collected from all three analytical routes and all three ground motions is summarised below. This envelope defines the design-basis response of the tower and serves as the reference data set for subsequent design decisions.
22. Conclusions
Four conclusions follow from the modal analysis and from the comparative seismic assessment carried out with the three calculation methods.
23. Engineering Recommendations Derived from the Analysis
The following recommendations translate the numerical findings into practical design and verification actions for communication monopole projects of similar configuration and site classification.
| Priority | Recommendation | Technical Justification |
|---|---|---|
| HIGH | Adopt the response spectrum method as the governing design check | Returns the highest (most conservative) stress and displacement envelope |
| HIGH | Locally reinforce the feeder-cable opening at segment 5 bottom | Identified as the single weakest link across all methods and all waves |
| MEDIUM | Verify anchor bolts and foundation separately | Excluded from this superstructure model; assumed rigid base |
| MEDIUM | Confirm the socket friction coefficient for the actual joint | μ = 0.3 assumed; socket slip governs segment interaction |
| LOW | Extend the mode count beyond six if additional margin is required | Accumulated mass at six modes is 88.5%, marginally under 90% |
| LOW | Re-assess if the site class changes to softer soil | Long-period tower is sensitive to site characteristic period shift |
24. Specification Snapshot — Structured Data Summary
| Structure type | Tapered thin-walled cantilever steel monopole (high-rise structure) |
| Height / mass | 40 m / ≈10.1 t |
| Material | Q345B, f = 310 MPa, fv = 180 MPa, end bearing 400 MPa |
| Cross-section | 12-sided polygon, wall 8 / 10 / 12 mm by segment |
| Segment count / length | 5 segments × 8 m |
| FE mesh | 52,834 nodes, 50,147 elements, minimum size 60 mm |
| Modal frequencies (X) | 0.63 / 2.96 / 7.69 / 14.74 Hz |
| Modal frequencies (Y) | 0.63 / 2.97 / 7.76 / 14.90 Hz |
| Seismic input | Intensity 8 rare earthquake, αmax = 0.9, Site Class IV, Group 3 |
| Ground motions | El Centro (0.4 g), Kobe (0.4 g), artificial (0.4 g) |
| Governing stress / displacement | 142 MPa / 602 mm (response spectrum) |
| Weak link | Feeder-cable opening at the bottom of segment 5 |